Exhibit 99.1
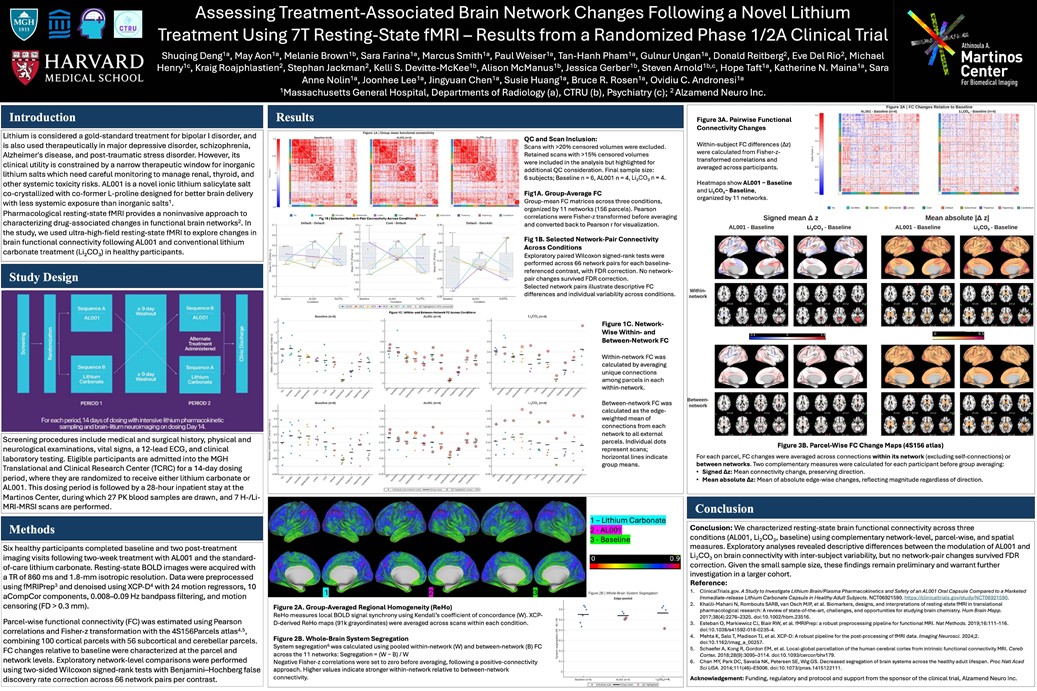
&' CTRU Lithium is considered a gold-standard treatment for bipolar I disorder, and is also used therapeutically in major depressive disorder, schizophrenia, Alzheimer's disease, and post-traumatic stress disorder. However, its clinical utility is constrained by a narrow therapeutic window for inorganic lithium salts which need careful monitoring to manage renal, thyroid, and other systemic toxicity risks. AL001 is a novel ionic lithium salicylate salt co-crystallized with co-former L-proline designed for better brain delivery with less systemic exposure than inorganic salts1. Pharmacological resting-state fMRI provides a noninvasive approach to characterizing drug-associated changes in functional brain networks2. In the study, we used ultra-high-field resting-state fMRI to explore changes in brain functional connectivity following AL001 and conventional lithium carbonate treatment (Li2C03) in healthy participants. Sequence A Screening procedures include medical and surgical history, physical and neurological examinations, vital signs, a 12-lead ECG, and clinical laboratory testing. Eligible participants are admitted into the MGH Translational and Clinical Research Center (TCRC) for a 14-day dosing period, where they are randomized to receive either lithium carbonate or AL001. This dosing period is followed by a 28-hour inpatient stay at the Martinas Center, during which 27 PK blood samples are drawn, and 7 H-/Li-MRI-MRSI scans are performed. Six healthy participants completed baseline and two post-treatment imaging visits following two-week treatment with AL001 and the standard-of-care lithium carbonate. Resting-state BOLD images were acquired with a TR of 860 ms and 1.8-mm isotropic resolution. Data were preprocessed using fMRIPrep3 and de noised using XCP-D4 with 24 motion regressors, 1 O aCompCor components, 0.008-0.09 Hz bandpass filtering, and motion censoring (FD> 0.3 mm). Parcel-wise functional connectivity (FC) was estimated using Pearson correlations and Fisher-z transformation with the 4S156Parcels atlas4?5, combining 100 cortical parcels with 56 subcortical and cerebellar parcels. FC changes relative to baseline were characterized at the parcel and network levels. Exploratory network-level comparisons were performed using two-sided Wilcoxon signed-rank tests with Benjamini-Hochberg false discovery rate correction across 66 network pairs per contrast. 0.7 0.6 0.5 0.2 o., ?som~ ?OOr1A1111 -~ ?I.Wolloe ?COAi ?Dtld ?~ ?rl'lflUJl'iut ?M~ Fig 1B I Selected Network-Pair Connectivity Across Conditions Default -Default 0.5 0.45 04 0.35 -i 03 ~0--25 l;' i 0.2 0.15 o, 0.05 Cont ? Oetault ? ? ? ? 0.35 Default -OorsAttn 0.3 ·r 0.25 ? ? ? 0.05 ? ? I ?-o'-----------,----------·0.05'-----------L2 ' -~ U: 0.8 a g tt 0.6 ? i ~ 0.4 C E i 0.2 0.3S ~ 0.3 " C ? ~ 0.25 C ? ? g 0.2 u ~ I 0.15 ~ o., I ~ 0.05 0 -0.05 Baseline ? ? ? ? ? ? .. J -? ? ? ? ? ALOO> Concf11ion Li,co, Baseline ALOOl Li,CO, Condilion Baseline ALOOl Li,CO, Condition 1--+-HCIO --+-HC2 --+-HCS --+-HC6 --+-HC7 --+-HC9 o QChighliglited(>lM-6censored)I Figure 1C I Within-and Between-Network FC Across Conditions Baseline {n=6) ALOOl {n=4) ,.2 ,.2 ' ? ' ? ? 0.8 0.8 ? ® ® ® ? ® ? 0.6 -8 ?o o., 7!J ? , ? ? T ® ? ® ? .JD ® ® ? ? ?? ? ® ? ? @ .... ~ 0 ? ? -.... o., ? ? o., ? ? ? @ ~ ~ ? ? -@ @ ? ? ? ? ? ? .., ? ? -e ? 0.2 0.2 ? ? 0 0 ··/// jt J <f'#/ I'// C "' / c? V ~ .."f-c.f Baseline (n=6) ALOOl (n=4) 0.3S 0.3S ? ? 0.3 0.3 @ ? ? ? ? ' @ ? ? 0.25 ® 0.25 ? ? ® ? .., 0 ? ? ? @ ® ® ? ? 0.2 ® 0.2 ? .... -? ? ? ? ~ j -. ? ' r., ~ ~ .... ? 0.15 ® ~ ~ 0.15 -... ? ? ? ? ? ? ? ? ? f> ® ? ? ? ... ? ? o., ? ? ? ? o., ® ® ? ? @ ? ? ? ? ? ? ? ? ? ? ? ? ? 0.05 ? 0.05 ? .... ? , ? ? ? ? 0 0 -0.05 -0.05 ? .a ? @ ? -? ? ""?<F / / ii' J<f'#//// a / ;f ? J .."f-cl I ? lndiwlual scar, (netwark color) -Gmup mean 0 QC hi,ghllQl'led. Cltr"l$U > 1M61 Figure 2A. Group-Averaged Regional Homogeneity (ReHo) 0 ? ? ? 0 ? ? ? QC and Scan Inclusion: Scans with >20% censored volumes were excluded. Retained scans with >15% censored volumes were included in the analysis but highlighted for additional QC consideration. Final sample size: 6 subjects; Baseline n = 6, AL001 n = 4, Li2C03 n = 4. Fig1A. Group-Average FC Group-mean FC matrices across three conditions, organized by 11 networks (156 parcels). Pearson correlations were Fisher-z transformed before averaging and converted back to Pearson r for visualization. Fig 1 B. Selected Network-Pair Connectivity Across Conditions Exploratory paired Wilcoxon signed-rank tests were performed across 66 network pairs for each baseline-referenced contrast, with FDR correction. No network-pair changes survived FDR correction. Selected network pairs illustrate descriptive FC differences and individual variability across conditions. Li2C03 (n=4) ® ® ? Ii) ® ~ -® -? ? ~ ? ... ? ? @ ? -? Li2C03 (n=4) @ @ @ @ ® ® ? ? ? "' ? ? ? ? ? I ? ? " 0.6 ® ., ? ? @ ? ? ? ?? ? Figure 1 C. Network-Wise Within-and Between-Network FC Within-network FC was calculated by averaging unique connections among parcels in each within-network. Between-network FC was calculated as the edge-weighted mean of connections from each network to all external parcels. Individual dots represent scans; horizontal lines indicate group means . -Lithium Carbonate !3 -Baselin 0 0,9 -Figure 2B I Whole-Brain System Segregation Edge-pooled ? ? ? ? Re Ho measures local BOLD signal synchrony using Kendall's coefficient of concordance (W). XCP-D-derived ReHo maps (91 k grayordinates) were averaged across scans within each condition. ? ? ? @ Figure 2B. Whole-Brain System Segregation System segregation6 was calculated using pooled within-network (W) and between-network (B) FC across the 11 networks: Segregation = (W -B) / W Negative Fisher-z correlations were set to zero before averaging, following a positive-connectivity approach. Higher values indicate stronger within-network relative to between-network connectivity. ' !0.4 10.3 [ i 0.2 Ji o., 0 Baseline (n=6) ALOOl (n=4) I ? lntli\liollal scan -Group mean o QC highlighted I Figure 3A. Pairwise Functional Connectivity Changes o., 0.4 Figure 3A I FC Changes Relative to Baseline ALOOl. Baseline (n~) Li2C03 ? Baseline (n~) >.>:.= IJ.' ::i"~?·~i .;;, I I ... . ..--.. ' . ~µ:., w,µlql ~~F.e51f."f.0 CT ~.-'l'.!,',.:!.';.:.[:a,.:_?~?G._,.,j...c..;hl!.,.~t:....:/-..-C.l..' ,..µ;_~ ,.... -1-? ' ' ?? , ¢+'-~Pl-l!!,:h" c.'H'· +i-.-F"'..c::"1+;, ·-... 0.2 ., Within-subject FC differences (t.z) were calculated from Fisher-z-transformed correlations and averaged across participants. ·0,2 . ' ~ :, Heatmaps show AL001 -Baseline and Li2C03-Baseline, organized by 11 networks. ?0,4 .Q,6 ., t' ' ,_ .. , ... ? ·-. . .,. . . ·~ ,._ , .. ? ? Vis ? SomMot ? D«SAlln ? SalventAAn ? LJ'Mbic ? Com ? Defaul1 ? Subcoflital ? Thalamus ? HippAmyg ? Cerebellum Signed mean l!:. z Mean absolute ll!:. zl ALOOl ? Baseline Li2C03 -Baseline ALOOl -Baseline Li2C03 -Baseline Within? network 0 4 0 0 4 0 0 5 Between-network Figure 3B. Parcel-Wise FC Change Maps (45156 atlas) For each parcel, FC changes were averaged across connections within its network (excluding self-connections) or between networks. Two complementary measures were calculated for each participant before group averaging: ? Signed ~z: Mean connectivity change, preserving direction. ? Mean absolute ~z: Mean of absolute edge-wise changes, reflecting magnitude regardless of direction. Conclusion: We characterized resting-state brain functional connectivity across three conditions (AL001, Li2C03, baseline) using complementary network-level, parcel-wise, and spatial measures. Exploratory analyses revealed descriptive differences between the modulation of AL001 and Li2C03 on brain connectivity with inter-subject variability, but no network-pair changes survived FDR correction. Given the small sample size, these findings remain preliminary and warrant further investigation in a larger cohort. Reference: 2. 1. ClinicalTrials.gov. A Study to Investigate Lithium Brain/Plasma Pharmacokinetics and Safety of an AL001 Oral Capsule Compared to a Marketed Immediate-release Lithium Carbonate Capsule in Healthy Adult Subjects. NCT06921590. https:/klinicaltrials,goy/study/NCT06921590. Khalili-Mahani N. Rom bouts SARB, van Osch MJP, et al. Biomarkers, designs, and interpretations of resting-state fMRI in translational pharmacological research: A review of state-of-the-art. challenges, and opportunities for studying brain chemistry. Hum Brain Mapp . 2017;38(4):2276-2325. doi:10.1002/hbm.23516. 3 . Esteban 0, Markiewicz CJ, Blair RW, et al. fMRIPrep: a robust preprocessing pipeline for functional MRI. Nat Methods. 2019;16:111-116. doi: 10.1038/s41592-018-0235-4. 4. Mehta K, Salo T, Madison TJ, et al. XCP-D: A robust pipeline for the post-processing of fMRI data. Imaging Neurosci. 2024;2. doi: 10.1162/imag_a_00257. 5. Schaefer A, Kong R, Gordon EM, et al. Local-global parcellation of the human cerebral cortex from intrinsic functional connectivity MRI. Cereb Cortex. 2018;28(9):3095-3114. doi:10.1093/cercor/bhx179. 6. Chan MY, Park DC, Savalia NK, Petersen SE, Wig GS. Decreased segregation of brain systems across the healthy adult lifespan. Proc Natl Acad Sci USA. 2014; 111 (46)-E5006. doi: 10.1073/pnas.1415122111. Acknowledgement: Funding, regulatory and protocol and support from the sponsor of the clinical trial, Alzamend Neuro Inc.